Excellent article by yhat on top 10 R packages:
http://blog.yhat.com/posts/10-R-packages-I-wish-I-knew-about-earlier.html
Excellent article by yhat on top 10 R packages:
http://blog.yhat.com/posts/10-R-packages-I-wish-I-knew-about-earlier.html
Standard deviation and variance are statistical measures of dispersion of data, i.e., they represent how much variation there is from the average, or to what extent the values typically “deviate” from the mean (average). A variance or standard deviation of zero indicates that all the values are identical.
Variance is the mean of the squares of the deviations (i.e., difference in values from the mean), and the standard deviation is the square root of that variance. Standard deviation is used to identify outliers in the data.
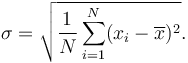
The formula for standard deviation and variance is often expressed using:
The variance of a set of n equally likely values can be written as:

The standard deviation is the square root of the variance:
Formulae with Greek letters have a way of looking daunting, but this less complicated than it seems. To put it in simple steps:
That gives the variance. Take the square root of the variance to find the standard deviation.
Let’s say a data set includes the height of six dandelions: 3 inches, 4 inches, 5 inches, 4 inches, 11 inches, and 6 inches.
First, find the mean of the data points: (3 + 4 + 5 + 4 + 11 + 7) / 6 = 5.5
So the mean height is 5.5 inches. Now we need the deviations, so we find the difference of each plant from the mean: -2.5, -1.5, -.5, -1.5, 5.5, 1.5
Now square each deviation and find their sum: 6.25 + 2.25 + .25 + 2.25 + 30.25 + 2.25 = 43.5
Now divide the sum of the squares by the number of data points, in this case plants: 43.5 / 6 = 7.25
So the variance of this data set is 7.25, which is a fairly arbitrary number. To convert it into a real-world measurement, take the square root of 7.25 to find the standard deviation in inches.
The standard deviation is about 2.69 inches. That means that for the sample, any dandelion within 2.69 inches of the mean (5.5 inches) is ‘normal’.
Deviations are squared to prevent negative values (deviations below the mean) from canceling out the positive values. This works because a negative number squared becomes a positive value. If you had a simple data set with deviations from the mean of +5, +2, -1, and -6, the sum of the deviations will come out as zero if the values aren’t squared (i.e. 5 + 2 – 1 – 6 = 0).
Variance is expressed as a mathematical dispersion. Since it’s an arbitrary number relative to the original measurements of the data set, it is difficult to visualize and apply in a real-world sense. Finding the variance is usually just the final step before finding the standard deviation. Variance values are sometimes used in finance and statistical formulas.
Standard deviation, which is expressed in the original units of the data set, is much more intuitive and closer to the values of the original data set. It is most often used to analyze demographics or population samples to gain a sense of what is normal in the population.

A normal distribution (Bell curve) with bands corresponding to 1σ
In a normal distribution, about 68% of the population (or values) falls within 1 standard deviation (1σ) of the mean and about 94% fall within 2σ. Values that differ from the mean by 1.7σ or more are usually considered outliers.
In practice, quality systems like Six Sigma attempt to reduce the rate of errors so that errors become an outlier. The term “six sigma process” comes from the notion that if one has six standard deviations between the process mean and the nearest specification limit, practically no items will fail to meet specifications.[1]
In real world applications, data sets used usually represent population samples, rather than entire populations. A slightly modified formula is used if population-wide conclusions are to be drawn from a partial sample.
A ‘sample standard deviation’ is used if all you have is a sample, but you wish to make a statement about the population standard deviation from which the sample is drawn

The only way sample standard deviation formula differs from the standard deviation formula is the “-1” in the denominator.
Using the dandelion example, this formula would be needed if we sampled only 6 dandelions, but wanted to use that sample to state the standard deviation for the entire field with hundreds of dandelions.
The sum of squares would now be divided by 5 instead of 6 (n – 1), which gives a variance of 8.7 (instead of 7.25), and a sample standard deviation of 2.95 inches, instead of 2.69 inches for the original standard deviation. This change is used to find a margin of error in a sample (9% in this case).
Credits:
“Standard Deviation vs Variance.” Diffen.com. Diffen LLC, n.d. Web. 18 Apr 2016. < http://www.diffen.com/difference/Standard_Deviation_vs_Variance >
In mathematics and statistics, the mean or the arithmetic mean of a list of numbers is the sum of the entire list divided by the number of items in the list. When looking at symmetric distributions, the mean is probably the best measure to arrive at central tendency. In probability theory and statistics, a median is that number separating the higher half of a sample, a population, or a probability distribution, from the lower half.
The Mean or average is probably the most commonly used method of describing central tendency. A mean is computed by adding up all the values and dividing that score by the number of values. The arithmetic mean of a sample  is the sum the sampled values divided by the number of items in the sample:

The Median is the number found at the exact middle of the set of values. A median can be computed by listing all numbers in ascending order and then locating the number in the center of that distribution. This is applicable to an odd number list; in case of an even number of observations, there is no single middle value, so it is a usual practice to take the mean of the two middle values.
Let us say that there are nine students in a class with the following scores on a test: 2, 4, 5, 7, 8, 10, 12, 13, 83. In this case the average score (or the mean) is the sum of all the scores divided by nine. This works out to 144/9 = 16. Note that even though 16 is the arithmetic average, it is distorted by the unusually high score of 83 compared to other scores. Almost all of the students’ scores are below the average. Therefore, in this case the mean is not a good representative of the central tendency of this sample.
The median, on the other hand, is the value which is such that half the scores are above it and half the scores below. So in this example, the median is 8. There are four scores below and four above the value 8. So 8 represents the mid point or the central tendency of the sample.

Credits:”Mean vs Median.” Diffen.com. Diffen LLC, n.d. Web. 21 Apr 2016. < http://www.diffen.com/difference/Mean_vs_Median >
Follow the link:
SBC The Critical Component
From TS 24.301 :
8.2.1.10:
EPS network feature support:
The network may include this IE in attach accept or TAU accept to inform the UE of the support of certain features. If this IE is not included then the UE shall interpret this as a receipt of an information element with all bits of the value part coded as zero. Note that this is an optional IE.
9.9.3.12A:
The EPS network feature support is a type 4 information element with a length of 3 octets and bits of third octet contains VoLTE feature support indicators as follows:
Bit 1 – IMS VoPS (IMS voice over PS session indicator)
0 – IMS voice over PS session in S1 mode not supported (VoLTE not supported)
1 – IMS voice over PS session in S1 mode supported (VoLTE supported)
Bit 2 – EMC BS (Emergency bearer services indicator)
0 – emergency bearer services in S1 mode not supported
1 – emergency bearer services in S1 mode supported
If IMS voice over PS session in S1 mode is not supported, MS may elect to utilize CS voice.
UE handling of this IE From TS 23.221:
If the UE is configured for Voice over IMS, the service domain selection functionality should take the “IMS voice over PS session supported indication” into account and should only initiate IMS voice calls (with the voice bearer in the PS domain) using the RAT where the “IMS voice over PS session supported indication” applies and indicates support.
MS identification:
Cause value = 2 (IMSI unknown in HLR)
This cause is sent to the MS if the MS is not known (registered) in the HLR. This cause code does not affect operation of the GPRS service, although is may be used by a GMM procedure.
Cause value = 3 (Illegal MS)
This cause is sent to the MS when the network refuses service to the MS either because an identity of the MS is not acceptable to the network or because the MS does not pass the authentication check, i.e. the SRES received from the MS is different from that generated by the network. When used by an MM procedure, except the authentication procedure, this cause does not affect operation of the GPRS service.
Cause value = 4 (IMSI unknown in VLR)
This cause is sent to the MS when the given IMSI is not known at the VLR.
Cause value = 5 (IMEI not accepted)
This cause is sent to the MS if the network does not accept emergency call establishment using an IMEI or not accept attach procedure for emergency services using an IMEI.
Cause value = 6 (Illegal ME)
This cause is sent to the MS if the ME used is not acceptable to the network, e.g. blacklisted. When used by an MM procedure, this cause does not affect operation of the GPRS service.
Subscription options:
Cause value = 11 (PLMN not allowed)
This cause is sent to the MS if it requests location updating in a PLMN where the MS, by subscription or due to operator determined barring is not allowed to operate.
Cause value = 12 (Location Area not allowed)
This cause is sent to the MS if it requests location updating in a location area where the HPLMN determines that the MS, by subscription, is not allowed to operate.
NOTE: If cause #12 is sent to a roaming subscriber the subscriber is denied service even if other PLMNs are available on which registration was possible.
Cause value = 13 (Roaming not allowed in this location area)
This cause is sent to an MS which requests location updating in a location area of a PLMN which by subscription offers roaming to that MS but not in that Location Area.
Cause value = 15 (No Suitable Cells In Location Area)
This cause is sent to the MS if it requests location updating in a location area where the MS, by subscription, is not allowed to operate, but when it should find another allowed location area in the same PLMN.
NOTE: Cause #15 and cause #12 differ in the fact that cause #12 does not trigger the MS to search for another allowed location area on the same PLMN.
Cause value = 25 (Not authorized for this CSG)
This cause is sent to the MS if it requests access in a CSG cell where the MS either has no subscription to operate or the MS’s subscription has expired and it should find another cell in the same PLMN.
NOTE: The MS not supporting CSG will not receive cause# 25, as such a MS is not supposed to try to access a CSG cell.
PLMN/Congestion/Authentication:
Cause value = 20 (MAC failure)
This cause is sent to the network if the USIM detects that the MAC in the AUTHENTICATION REQUEST or AUTHENTICATION_AND_CIPHERING REQUEST message is not fresh (see 3GPP TS 33.102 [5a]).
Cause value = 21 (Synch failure)
This cause is sent to the network if the USIM detects that the SQN in the AUTHENTICATION REQUEST or AUTHENTICATION_AND_CIPHERING REQUEST message is out of range (see 3GPP TS 33.102 [5a]).
Cause value = 17 (Network failure)
This cause is sent to the MS if the MSC cannot service an MS generated request because of PLMN failures, e.g. problems in MAP.
Cause value = 22 (Congestion)
This cause is sent if the service request cannot be actioned because of congestion (e.g. no channel, facility busy/congested etc.).
Cause value = 23 (GSM authentication unacceptable)
This cause is sent to the network in Iu mode if a USIM is inserted in the MS and there is no Authentication Parameter AUTN IE present in the AUTHENTICATION REQUEST or AUTHENTICATION_AND_CIPHERING REQUEST message.
Cause value = 32 (Service option not supported)
This cause is sent when the MS requests a service/facility in the CM SERVICE REQUEST message which is not supported by the PLMN.
Cause value = 33 (Requested service option not subscribed)
This cause is sent when the MS requests a service option for which it has no subscription.
Cause value = 34 (Service option temporarily out of order)
This cause is sent when the MSC cannot service the request because of temporary outage of one or more functions required for supporting the service.
Cause value = 38 (Call cannot be identified)
This cause is sent when the network cannot identify the call associated with a call re-establishment request.
Causes related to invalid messages
Cause value = 95 (Semantically incorrect message)
See annex H, subclause H.5.10.
Cause value = 96 (Invalid mandatory information)
See annex H, subclause H.6.1.
Cause value = 97 (Message type non-existent or not implemented)
See annex H, subclause H.6.2.
Cause value = 98 (Message not compatible with protocol state)
See annex H, subclause H.6.3.
Cause value = 99 (Information element non-existent or not implemented)
See annex H, subclause H.6.4.
Cause value = 100 (Conditional IE error)
See annex H, subclause H.6.5.
Cause value = 101 (Message not compatible with protocol state)
See annex H, subclause H.6.6.
Cause value = 111 (Protocol error, unspecified)
See annex H, subclause H.6.8.
Cause Codes for GMM:
Cause value = 7 (GPRS services not allowed)
This cause is sent to the MS when it is not allowed to operate GPRS services.
Cause value = 8 (GPRS services and non-GPRS services not allowed)
This cause is sent to the MS when it is not allowed to operate either GPRS or non-GPRS services.
Cause value = 9 (MS identity cannot be derived by the network)
This cause is sent to the MS when the network cannot derive the MS’s identity from the P-TMSI in case of inter-SGSN routing area update.
LSOF lists on its standard output file information about files opened by processes, it is a powerful utility that combines capabilities of ps and netstat commands and it is available to sysadmin (root) users only.
Usage:
lsof 4.82
[-?abhlnNoOPRtUvVX] [+|-c c] [+|-d s] [+D D] [+|-f[gG]] [+|-e s]
[-F [f]] [-g [s]] [-i [i]] [+|-L [l]] [+m [m]] [+|-M] [-o [o]] [-p s]
[+|-r [t]] [-s [p:s]] [-S [t]] [-T [t]] [-u s] [+|-w] [-x [fl]] [–] [names]
Use the “-h” option to get more help information.
The ‘^’ is used to exclude certain things from output when -u, -p, -g, -c and -s options are used.
Following usage excludes root user from the output:
-a option can be used for AND operation, following produces listing of only UNIX socket files AND those belong to processes owned by users root and ntp:
List files that belong to users root or ntp and have network connection to address 127.0.0.1:
List processes that starts with letter “a”, “b” and “c”
Lists NFS files:
Lists process with port id:9650 and inhibits conversion from port numbers to port names (-P) and also inhibits conversion from network addresses to hostnames (-n)
COMMAND PID USER FD TYPE DEVICE SIZE/OFF NODE NAME
java 8250 root 115u IPv4 503039 0t0 TCP 10.1.1.1:57218->10.2.2.2:9650 (ESTABLISHED)
list only network files with TCP state LISTEN:
list network files with all UDP states except Idle:
TS23.007 – Restoration Procedures, VLR, HLR, HSS, MME, SGW, PGW
http://www.etsi.org/deliver/etsi_ts/123000_123099/123007/12.06.00_60/ts_123007v120600p.pdf
TS23.012 – Location Management Procedures, HLR, VLR
http://www.etsi.org/deliver/etsi_ts/123000_123099/123012/12.00.00_60/ts_123012v120000p.pdf
TS23.116 – Super-charger
http://www.etsi.org/deliver/etsi_ts/123100_123199/123116/12.00.00_60/ts_123116v120000p.pdf
TS24.301 – NAS/EMM Procedures, Attach, TAU, Service Request, Paging, Default Bearer, Dedicated Bearer
http://www.etsi.org/deliver/etsi_ts/124300_124399/124301/10.03.00_60/ts_124301v100300p.pdf
TS29.061 – Diameter/Radius on Gi/SGi interface, Diameter on Gmb & SGmb interfaces, PLMN
http://www.etsi.org/deliver/etsi_ts/129000_129099/129061/09.06.00_60/ts_129061v090600p.pdf
TS29.118 – VLR SGs Interface
http://www.etsi.org/deliver/etsi_ts/129100_129199/129118/11.04.00_60/ts_129118v110400p.pdf
TS29.274 – GTPv2, Create/Modify/Update Bearer, Data Downlink Notification
http://www.etsi.org/deliver/etsi_ts/124300_124399/124301/10.03.00_60/ts_124301v100300p.pdf
TS29.303 – DNS Procedures
http://www.etsi.org/deliver/etsi_ts/129300_129399/129303/09.03.00_60/ts_129303v090300p.pdf
TS36.413 – S1AP, E-RAB Setup, UE Context Setup, Handover, Location Reporting, Paging, Extended Service Request
http://www.etsi.org/deliver/etsi_ts/136400_136499/136413/10.05.00_60/ts_136413v100500p.pdf
RFC-326– SIP, Register
https://www.ietf.org/rfc/rfc3261.txt
TS23.041 – Cell Broadcast Service
https://www.etsi.org/deliver/etsi_ts/123000_123099/123041/11.04.00_60/ts_123041v110400p.pdf
TS33.106 – Lawful Interception
https://www.etsi.org/deliver/etsi_ts/133100_133199/133106/13.02.00_60/ts_133106v130200p.pdf
TS22.153 – Multimedia Priority Service
https://www.etsi.org/deliver/etsi_ts/122100_122199/122153/12.00.00_60/ts_122153v120000p.pdf
R-Factor:
ITU-T recommendation G.107 describes a model for transmission planning called the E-model. The E-model combines a number of different impairments to calculate an overall quality measure, R.
R = Ro – Is – Id – Ie + A
The R factor ranges between 0 and 100, 0 being the worst and 100 the best.
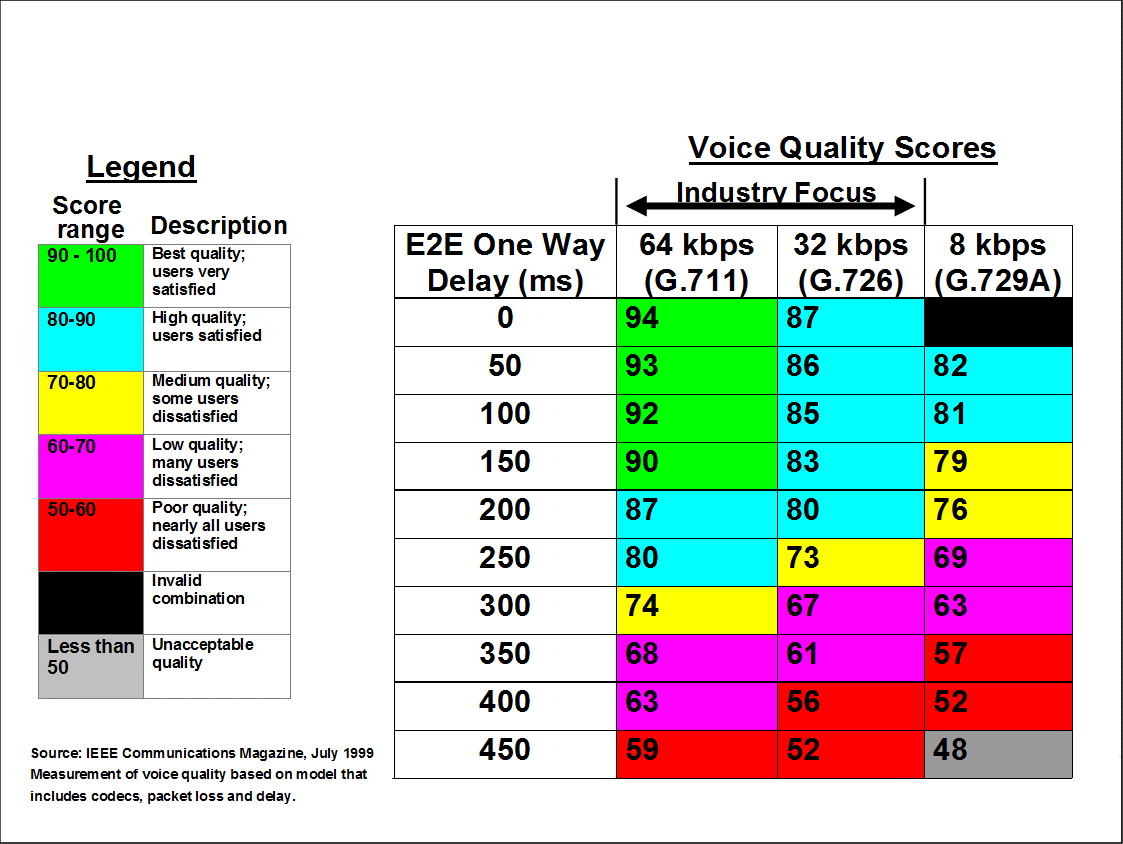
Mean opinion score (MOS) is a test used to obtain the human user’s view of the quality of the network. It ranges from 1 to 5, 1 being the worst and 5 the best.
